Census Retail Sales Data Reveals DC Economy's 2026 Pulse
The Census Bureau's Monthly Retail Trade report shows how Washington DC's economy is performing in 2026. What the numbers mean for residents and policymakers.
In brief
The U.S. Census Bureau's Monthly Retail Trade and Food Services report is the federal government's primary measure of consumer spending across the United States. Released monthly, it tracks sales across categories from auto dealers to grocery stores to online retailers. For Washington DC — a city whose economy is uniquely tethered to federal employment, contractor spending, and policy cycles — these numbers carry outsized weight in 2026.
🔑 Key Takeaways
The Census Bureau's Monthly Retail Trade report is the gold-standard federal dataset for U.S. consumer spending, covering over 13 retail categories.
Washington DC's retail economy faces distinct pressures in 2026, including federal workforce reductions, hybrid work patterns, and shifting foot traffic in commercial corridors like Penn Quarter and Georgetown.
National retail trends — particularly in food services, e-commerce, and general merchandise — directly influence DC's tax base and the District government's budget projections.
The report's advance estimates, released roughly two weeks after each reference month, are the first hard signal economists and policymakers use to gauge economic momentum.
Analysts tracking DC's Ward 2 and Ward 6 retail corridors watch Census data alongside local DCRA licensing trends to spot early signs of commercial contraction or expansion.
What the Monthly Retail Trade Report Actually Measures
Every month, the U.S. Census Bureau surveys approximately 5,500 retail and food service firms to produce its Monthly Retail Trade (MRT) report. The survey captures total sales, e-commerce revenues, and end-of-month inventories across 13 major retail categories — everything from motor vehicle dealers and gasoline stations to clothing stores and nonstore retailers. The advance estimate drops roughly 12 business days after the reference month closes; revised figures follow in subsequent releases.
The report feeds directly into the Bureau of Economic Analysis's GDP calculations and informs Federal Reserve policy deliberations. When retail numbers surprise to the upside or downside, markets move — and so do the political conversations happening in the Rayburn House Office Building and the Dirksen Senate Office Building just miles from the Census Bureau's Suitland, Maryland headquarters.
For context, the Bureau of Economic Analysis uses MRT data as a core input for Personal Consumption Expenditures (PCE), the Fed's preferred inflation gauge. That chain of data dependency makes the Census retail report one of the most consequential recurring federal data releases on the economic calendar.
How DC's Retail Economy Diverges From the National Picture
Washington DC's retail landscape operates on different fundamentals than most American cities. The District's consumer base includes roughly 700,000 residents spread across eight wards, plus a daytime population that swells by hundreds of thousands when federal employees, contractors, lobbyists, and tourists flood the city's commercial corridors — from the H Street NE strip to the boutiques of Georgetown's M Street to the food halls anchoring Navy Yard.
That daytime economy took a measurable hit beginning in 2025 when the Trump administration's Department of Government Efficiency (DOGE) initiatives triggered federal workforce reductions and return-to-office mandates that paradoxically emptied some office corridors while refilling others. By 2026, the net effect on District retail remains uneven: lunch spots near the State Department and the Pentagon City Metro saw foot traffic rebound, while some K Street adjacent retailers continued to feel the drag of downsized lobbying operations.
The Office of the Chief Financial Officer for the District of Columbia closely monitors Census retail data because local sales tax revenues — a critical budget line — track consumer spending patterns almost directly. A sustained national retail slowdown registered in Census data translates, within quarters, to tighter budget projections at the Wilson Building on Pennsylvania Avenue.
Why Federal Employment Trends Shape DC Retail More Than Any Other Variable
No American city is more exposed to federal payroll dynamics than Washington DC. The federal government employs approximately 230,000 workers in the DC metropolitan area, according to Bureau of Labor Statistics regional data — a concentration that makes every federal hiring freeze, reduction-in-force, or telework policy a de facto retail economic event.
When federal employees work in-office, they eat lunch in Chinatown, grab coffee near Farragut North, and shop during lunch breaks on F Street NW. When they work from home in Fairfax County or Prince George's County, those dollars stay in the suburbs. The Monthly Retail Trade report captures the aggregate national result of these behavioral shifts, but DC's ward-level economic development offices — particularly the Deputy Mayor for Planning and Economic Development — must read between the lines to assess the District-specific impact.
The 2026 retail environment also reflects the lingering influence of elevated interest rates on big-ticket spending categories. Furniture and home furnishings stores, electronics retailers, and building material suppliers — all tracked in the Census MRT — have faced headwinds as mortgage origination slowed and the DC-area housing market tightened in upper Northwest neighborhoods like Chevy Chase DC and Tenleytown.
E-Commerce Growth and What It Means for DC's Neighborhood Retail Corridors
Get The DC Insider
Our best stories, every Tuesday and Friday. Free.
Subscribe
The Census Bureau's MRT report has tracked the steady rise of nonstore retailers — primarily e-commerce — as a share of total retail sales for over a decade. That shift carries specific consequences for neighborhood retail corridors across the District, where independent retailers on 14th Street NW, Barracks Row on Capitol Hill, and the Georgia Avenue corridor in Petworth compete against Amazon Prime delivery windows that now measure in hours, not days.
DC's Department of Small and Local Business Development (DSLBD) has pushed back against the e-commerce tide through neighborhood-level grant programs and the DC Main Streets initiative, which channels resources into commercial revitalization across 11 designated corridors. But the Census data reflects a structural national headwind: nonstore retail has consistently outpaced brick-and-mortar categories in year-over-year growth, a trend that shows no signs of reversal in the 2026 data environment.
For DC-watchers who track retail as a proxy for neighborhood health — and who follow WDCM's DC Neighborhood Market Report — the MRT data provides the macroeconomic backdrop against which local vacancy rates, new business licenses, and commercial lease activity play out.
Why This Matters in Washington
Washington DC sits at a unique intersection: it is simultaneously a subject of federal economic data and a city that must govern itself using that same data. The Monthly Retail Trade report is produced by a federal agency headquartered in the DC metro area, fed into policy frameworks debated on Capitol Hill, and ultimately felt by the small business owner on U Street NW wondering whether foot traffic will return. That circularity is distinctly Washington — data as both mirror and map.
For the DC Council's Committee on Business and Economic Development, Census retail data is a quarterly reality check on whether the District's economic diversification strategy — expanding the tech sector, supporting the hospitality industry anchored by the Walter E. Washington Convention Center, and cultivating the creative economy in Shaw and Brookland — is actually reducing the city's historic overdependence on federal spending. The short answer, as of 2026: progress is real, but the federal tether remains the dominant variable in any honest reading of DC's retail economy.
Reading the Census Data: What to Watch in Each Monthly Release
Economists and policy analysts focus on three specific signals when each MRT report drops. First, the month-over-month percentage change in total retail and food service sales — a positive reading above 0.3% is generally considered healthy; anything negative for two consecutive months raises recession flags. Second, the year-over-year comparison, which strips out seasonal volatility. Third, the revision to prior months, which often tells a more honest story than the headline advance estimate.
For DC specifically, the food services and drinking places subcategory is the most locally sensitive metric. Restaurant sales in the District — from the Michelin-starred kitchens of Shaw to the fast-casual corridors of Columbia Heights — track closely with tourism volume, federal worker in-office rates, and the conference calendar at the Convention Center. A soft reading in that subcategory is, for DC purposes, often more diagnostic than the headline retail number.
FAQ: Census Monthly Retail Trade Report and Washington DC
What is the Census Bureau's Monthly Retail Trade report?
The Monthly Retail Trade and Food Services report, published by the U.S. Census Bureau, measures total sales at retail establishments and food service businesses across the United States. It surveys roughly 5,500 firms monthly and covers 13 retail categories. The advance estimate releases approximately 12 business days after the reference month ends.
How does national retail data affect Washington DC's local economy?
DC's economy is unusually sensitive to federal policy and employment dynamics, which drive consumer spending in neighborhood retail corridors across the city. Weak national retail numbers often foreshadow tighter District government budgets, since DC's sales tax revenue tracks consumer spending closely. The Office of the Chief Financial Officer monitors Census data as part of its revenue forecasting.
Why does federal workforce policy impact DC retail sales?
With approximately 230,000 federal employees in the DC metro area, shifts in telework policy, hiring freezes, or workforce reductions directly affect foot traffic — and therefore sales — at restaurants, coffee shops, and retailers near federal office clusters in Foggy Bottom, the Federal Triangle, and Capitol Hill.
Where can I access the Census Bureau's Monthly Retail Trade report?
The report is publicly available at census.gov/retail. New releases follow a published schedule, with advance estimates dropping mid-month for the prior month's data. Historical data series are also available for download in multiple formats.
What retail categories matter most for DC's neighborhood economies?
Food services and drinking places is the most locally sensitive category for the District, given DC's restaurant-dense neighborhoods and the correlation between dining activity and federal worker in-office rates. General merchandise and clothing stores also matter for major retail corridors like Georgetown and Penn Quarter.
How does e-commerce growth in Census data affect DC's small businesses?
Rising nonstore retail (e-commerce) as a share of total sales, documented in each MRT release, puts structural pressure on DC's neighborhood brick-and-mortar retailers. Programs like DC Main Streets and DSLBD grant initiatives attempt to offset this trend, but the Census data consistently shows national e-commerce share expanding — a headwind for independent retailers on corridors like 14th Street NW and H Street NE.
The bottom line: The Census Bureau's Monthly Retail Trade report isn't just an economic data release — in Washington DC, it's a policy document, a budget signal, and a neighborhood health indicator all in one. As the District navigates federal workforce shifts, e-commerce competition, and the ongoing push to diversify beyond its government-dependent economic base, each monthly MRT release offers the clearest available read on whether that diversification is working. Watch the food services subcategory, track the federal in-office rate, and follow the revisions — that's where the real story lives.
What to Watch Next: The next Monthly Retail Trade advance estimate will test whether consumer spending held through the late spring period, when DC's tourism season accelerates and Convention Center bookings peak. If food services numbers soften despite the seasonal tailwind, it will signal deeper structural weakness in the District's downtown retail corridor — and trigger hard conversations at the Wilson Building about revenue projections for the remainder of fiscal year 2026. Follow WDCM Politics and Power Moves for ongoing coverage.
Reporting drawn from: U.S. Census Bureau. Washington DC Magazine provides original analysis, DC-specific context, and editorial perspective beyond the source material.This article was produced with AI assistance and reviewed by WDCM editorial staff. Washington DC Magazine is committed to accuracy, transparency, and editorial integrity. If you believe any information in this article requires correction, please contact editor@washingtondcmagazine.com.
Featured in WDCM?
Share your feature like a headline.
Turn this story into branded graphics for Instagram, your story and LinkedIn in one tap.
Washington DC Magazine is an independent digital publication covering politics, culture, business, and lifestyle in the nation's capital. We publish original reporting, analysis, and curated coverage from across the DMV region — Washington, DC; Northern Virginia; and suburban Maryland.
Our Mission
We believe DC deserves a modern, fast, accessible publication that reflects the full breadth of the city — from Capitol Hill power brokers to Howard University students, from Georgetown galleries to U Street nightlife, from Anacostia neighborhood organizers to K Street consultants. Washington DC Magazine exists to inform, entertain, and connect the people who live, work, and shape policy in this remarkable city.
What We Cover
Politics & Power Moves — Federal policy, local DC government, lobbying, and the people who pull the levers in Washington.
Culture & The Circuit — Music, arts, nightlife, Black culture, fashion, and the social scene that defines DC after hours.
Business & Money — DC's economy, founders, real estate, and the deals that shape the region.
Sports — The Commanders, Nationals, Wizards, Capitals, Mystics, Spirit, and Howard Bison.
Lifestyle — Dining, travel, luxury, wellness, and the everyday experience of living in the DMV.
Howard & HBCU — Howard University and HBCU news, culture, and community.
Gen Z DC — How the next generation is reshaping the city.
Editorial Independence
Washington DC Magazine is editorially independent. Our newsroom decisions are not influenced by advertisers, sponsors, members, or any outside party. We disclose all sponsored content clearly and separately from editorial coverage. For more, see our Editorial Policy and Advertising Disclosure.
Founder
Washington DC Magazine was founded by Rodriquez Wright II. Wright oversees editorial direction, partnerships, and the publication's growth.
Contact
For editorial tips, advertising inquiries, corrections, or general questions, please visit our Contact page or email editor@washingtondcmagazine.com. We respond within one business day.
Washington DC Magazine is published by Washington DC Magazine LLC, headquartered in Washington, DC.
We welcome your questions, story tips, corrections, advertising inquiries, and feedback. Our team responds to most messages within one business day.
General & Editorial
For news tips, story ideas, press releases, op-ed submissions, and general editorial questions:
Washington DC Magazine 1701 Pennsylvania Avenue NW, Suite 200 Washington, DC 20006 United States
Please use email for the fastest response. Physical mail is collected weekly.
Last updated: May 22, 2026
Washington DC Magazine ("we," "us," or "our") respects your privacy. This Privacy Policy explains what information we collect, how we use it, and the choices you have. It applies to washingtondcmagazine.com and any related newsletters, apps, or services we operate.
1. Information We Collect
We collect information in three ways:
Information you provide. When you subscribe to a newsletter, comment, contact us, or submit a tip, you may give us your name, email address, payment information (processed by our payment processor), and any content you share.
Information collected automatically. When you visit the site, we and our service providers automatically collect device, browser, and usage data such as IP address, browser type, operating system, referring URL, pages viewed, time on page, and click behavior. We use cookies, web beacons, and similar technologies to do this. See our Cookie Policy.
Information from third parties. We may receive information from analytics providers, advertising partners, social platforms, and identity providers when you connect those services to us.
2. How We Use Your Information
We use information to:
Deliver, operate, and improve the website and newsletters;
Personalize content and recommendations;
Send transactional and marketing emails (you can unsubscribe at any time);
Measure and analyze audience engagement;
Serve and measure advertising, including personalized ads;
Detect, investigate, and prevent fraud and abuse;
Comply with legal obligations and enforce our Terms of Use.
3. Advertising & Google AdSense
Washington DC Magazine uses third-party advertising companies, including Google AdSense, to serve ads when you visit our site. These companies may use information (not including your name, address, email, or phone number) about your visits to this and other websites to provide advertisements about goods and services of interest to you.
Google, as a third-party vendor, uses cookies (including the DoubleClick DART cookie) to serve ads based on your prior visits to our website or other websites. You may opt out of personalized advertising by visiting Google Ads Settings or aboutads.info.
We and our partners use cookies, pixels, local storage, and similar technologies to remember you, measure traffic, and serve advertising. You can control cookies through your browser settings. Disabling cookies may affect site functionality. See our Cookie Policy for details.
5. How We Share Information
We do not sell your personal information for money. We share information with:
Service providers (hosting, analytics, email delivery, payment processors, advertising networks) who process data on our behalf;
Advertising partners for ad serving and measurement, as described above;
Legal authorities when required by law, subpoena, or to protect rights and safety;
Business transfers in connection with a merger, acquisition, or sale of assets.
6. Your Rights & Choices
Depending on where you live, you may have the right to access, correct, delete, or port your personal information, opt out of certain uses (including targeted advertising), and lodge a complaint with a regulator. To exercise these rights, email privacy@washingtondcmagazine.com.
California residents: Under the CCPA/CPRA you have the right to know, delete, correct, and opt out of "sales" or "sharing" of personal information. We honor Global Privacy Control (GPC) signals.
EU/UK/EEA residents: We process personal data on the lawful bases of consent, contract, legal obligation, and legitimate interests. You may withdraw consent at any time.
7. Children
Our site is not directed to children under 13, and we do not knowingly collect personal information from children under 13. If you believe a child has provided us with personal information, please email us and we will delete it.
8. Data Retention & Security
We retain personal information only as long as needed to fulfill the purposes described here, comply with law, and resolve disputes. We use reasonable administrative, technical, and physical safeguards to protect your information, but no system is 100% secure.
9. International Transfers
We are based in the United States. If you access the site from outside the U.S., your information will be transferred to and processed in the U.S. and other countries where our service providers operate.
10. Changes
We will update this Privacy Policy from time to time. We will post the revised version on this page and update the "Last updated" date. Material changes will be communicated through the site or by email.
11. Contact
Questions about this policy? Email privacy@washingtondcmagazine.com or write to Washington DC Magazine, 1701 Pennsylvania Avenue NW, Suite 200, Washington, DC 20006.
Last updated: May 22, 2026
These Terms of Use ("Terms") govern your access to and use of washingtondcmagazine.com and any related services (the "Service") operated by Washington DC Magazine LLC ("we," "us," "our"). By using the Service, you agree to these Terms. If you do not agree, do not use the Service.
1. Eligibility
You must be at least 13 years old to use the Service. If you are under 18, you may only use the Service with a parent or legal guardian's involvement.
2. Your Account
Some features (newsletters, membership, comments) require an account. You are responsible for the accuracy of the information you provide and for keeping your credentials secure. You are responsible for all activity that occurs under your account.
3. Acceptable Use
You agree not to:
Violate any law or third-party right;
Post unlawful, defamatory, harassing, hateful, or infringing content;
Impersonate any person or entity;
Scrape, crawl, harvest, or otherwise extract content without our written permission, except for ordinary indexing by search engines;
Reverse engineer, decompile, or attempt to derive source code from any portion of the Service;
Interfere with or disrupt the Service, including by transmitting malware or attempting unauthorized access;
Use the Service to train any machine learning model without our written permission.
4. Content & Intellectual Property
All content on the Service — including articles, images, audio, video, logos, code, and design — is owned by Washington DC Magazine LLC or its licensors and is protected by copyright, trademark, and other laws. You may view content for personal, non-commercial use. Any other use requires our prior written consent.
If you submit comments, tips, photos, or other content, you grant us a worldwide, royalty-free, non-exclusive, sublicensable, perpetual license to use, reproduce, modify, publish, and display that content in connection with the Service. You represent that you own or have the right to submit the content and that the content does not violate any third-party right.
6. Advertising & Sponsorship
The Service includes advertising and sponsored content. Sponsored content is labeled. We are not responsible for the content of third-party advertisements or for the products or services advertisers offer. See our Advertising Disclosure.
7. Third-Party Links
The Service may link to third-party websites and services that we do not control. We are not responsible for their content, privacy practices, or terms.
8. Disclaimers
The Service is provided "AS IS" and "AS AVAILABLE" without warranties of any kind, express or implied, including merchantability, fitness for a particular purpose, and non-infringement. We do not warrant that the Service will be uninterrupted, error-free, or secure. Editorial content is for general information and is not legal, medical, financial, or investment advice.
9. Limitation of Liability
To the maximum extent permitted by law, Washington DC Magazine LLC and its officers, employees, and contractors will not be liable for any indirect, incidental, special, consequential, or punitive damages, or any loss of profits, data, or goodwill, arising from your use of the Service. Our total liability for any claim related to the Service will not exceed one hundred U.S. dollars (US$100).
10. Indemnification
You agree to defend, indemnify, and hold harmless Washington DC Magazine LLC from any claim, liability, damage, loss, and expense (including reasonable attorneys' fees) arising from your breach of these Terms or your use of the Service.
11. Termination
We may suspend or terminate your access to the Service at any time, with or without notice, for any reason, including violation of these Terms.
12. DMCA / Copyright Complaints
If you believe content on the Service infringes your copyright, see our DMCA Policy.
13. Governing Law & Disputes
These Terms are governed by the laws of the District of Columbia, without regard to conflict-of-laws principles. Any dispute will be brought exclusively in the state or federal courts located in Washington, DC, and you consent to personal jurisdiction there.
14. Changes
We may modify these Terms at any time. We will post the updated Terms on this page with a new "Last updated" date. Your continued use after changes become effective constitutes acceptance.
Washington DC Magazine is committed to accurate, fair, and independent journalism. This Editorial Policy explains how we report, edit, and publish.
Editorial Independence
Our newsroom is editorially independent. Advertisers, sponsors, and members do not influence editorial coverage. No advertiser receives advance notice of stories that mention them. Sponsored content is created and labeled separately from editorial coverage — see our Advertising Disclosure.
Accuracy & Verification
We verify facts before publishing. Where appropriate, we identify sources, link to primary documents, and quote on the record. When we rely on anonymous sources, we explain why, and at least one editor knows the source's identity.
Fairness & Balance
We seek comment from subjects of critical reporting. We present multiple perspectives on contested issues. We distinguish news reporting from opinion and label opinion content clearly.
Use of Artificial Intelligence
Washington DC Magazine uses AI tools to assist with research, summarization, drafting, copy editing, headline testing, and content curation across a wide range of public news sources. Every story is reviewed before publication, and editorial judgment about what we cover and how we frame it rests with our human editors. We do not publish AI-generated content as if it were written by a specific human author when it was not. We label AI-assisted summaries clearly (e.g., our "Quick Answer" box).
Sourcing
We aggregate, curate, and re-report from a wide range of news sources across the DMV and nationally. When we build on reporting from another outlet, we credit and link to the original source. We do not copy material verbatim.
Corrections & Updates
We promptly correct factual errors. Corrections are noted at the bottom of the affected article and, when material, at the top. We do not silently delete or rewrite published stories. See our Corrections Policy.
Conflicts of Interest
Editorial staff disclose any potential conflicts of interest — financial, personal, or political — that could affect their reporting. Staff recuse themselves from coverage where a conflict exists.
Photography & Images
We use licensed stock photography, original photography, and editorial images credited to their sources. We do not manipulate news photographs in ways that alter their meaning. AI-generated illustrations, when used, are labeled.
User Comments
If we enable comments, they are moderated. We remove spam, harassment, hate speech, and personal attacks. Comments do not reflect the views of Washington DC Magazine.
Washington DC Magazine is committed to accuracy. When we make a factual error, we correct it promptly and transparently.
How We Handle Corrections
Substantive errors (wrong name, wrong date, wrong number, misattributed quote, factual misstatement) are corrected as soon as we are aware of them. A correction note appears at the bottom of the article — and at the top if the error was material to the story's main point.
Minor copy edits (typos, broken links, formatting) may be fixed silently if they do not change the meaning of the article.
Significant updates (new information that materially changes the story) are noted with a clearly-labeled "UPDATE" or "Editor's Note" at the top of the article.
Retractions. If a story is so flawed that a correction cannot fix it, we will retract it. The original URL will display an explanation of why the story was retracted.
Request a Correction
If you've spotted an error in our reporting, please tell us:
Please include: the article URL, the specific error, what the accurate information is, and (if possible) a source that confirms it. We respond within one business day.
What We Do Not Correct
We do not remove published articles to make subjects look better. We do not change quotes after publication. We do not retroactively edit headlines to soften them. If you disagree with our reporting but cannot identify a factual error, we are happy to publish a letter to the editor on the matter.
Last updated: May 22, 2026
Washington DC Magazine participates in affiliate marketing programs. This disclosure explains what that means for you as a reader.
What Is an Affiliate Link?
An affiliate link is a special URL that lets a retailer or service know that a sale or sign-up came from us. If you click an affiliate link and then make a purchase, we may receive a small commission at no additional cost to you.
Where We Use Affiliate Links
You may encounter affiliate links in:
Dining, travel, and lifestyle round-ups (hotels, restaurants, booking platforms);
Service comparisons (real estate platforms, ticketing, streaming);
Some newsletter recommendations.
Our Editorial Standards
Affiliate relationships do not influence what we cover or what we recommend. We choose products and venues we genuinely believe are worth our readers' attention. Where multiple retailers sell the same product, we generally pick the option offering the best price and customer experience — not the highest commission.
If we did not include an affiliate link, we would still recommend the same things.
FTC Compliance
Per the U.S. Federal Trade Commission's Endorsement Guides, we disclose material connections with companies whose products we endorse. Affiliate relationships are one such material connection.
Specific Programs
Washington DC Magazine is a participant in the Amazon Services LLC Associates Program, an affiliate advertising program designed to provide a means for sites to earn advertising fees by advertising and linking to Amazon.com. We may also participate in affiliate programs operated by Booking.com, Expedia, Hotels.com, Resy, OpenTable, Ticketmaster, StubHub, and other retailers from time to time.
Washington DC Magazine is supported by advertising. This disclosure explains the kinds of advertising we accept and how we keep editorial coverage independent.
Display Advertising
We serve display ads through third-party networks, including Google AdSense. These ads are clearly distinguishable from editorial content and are typically labeled "Advertisement," "Ad," or "Sponsored." Google and other ad partners may use cookies to serve personalized ads. See our Privacy Policy and Cookie Policy.
Sponsored Content
From time to time we publish sponsored articles, partnerships, and branded series. These are clearly labeled as "Sponsored," "Paid Partnership," or "Presented by [Sponsor]." Sponsored content is created in collaboration with the sponsor and does not represent the independent reporting of our newsroom.
Newsletter & Event Sponsorships
Our newsletter, The DC Insider, may include sponsored placements clearly marked as such. Our events and live programming may have presenting sponsors whose involvement is disclosed.
Our newsroom decides what to cover and how to cover it. Advertisers and sponsors have no editorial control, do not see stories before publication, and cannot remove or edit coverage. Buying an ad does not buy favorable coverage.
What We Won't Accept
We do not accept advertising for:
Tobacco, vaping, or e-cigarette products;
Hate speech, extremism, or discriminatory content;
Sexually explicit material;
Get-rich-quick schemes, fake supplements, or fraudulent products;
Unregulated cryptocurrency offerings or unlicensed financial advice;
Any product or service we believe is harmful to readers.
This Cookie Policy explains how Washington DC Magazine uses cookies and similar technologies on washingtondcmagazine.com.
What Are Cookies?
Cookies are small text files placed on your device by websites you visit. They are widely used to make websites work, improve user experience, and provide reporting information to site owners.
Types of Cookies We Use
Strictly necessary cookies — required for the site to function (e.g., remembering you are signed in, keeping your reading position).
Preference cookies — remember your settings (e.g., dark mode, location).
Analytics cookies — help us understand how readers use the site so we can improve it. We use providers such as Google Analytics, Plausible, and Cloudflare Web Analytics from time to time.
Advertising cookies — used by us and our advertising partners (including Google AdSense) to deliver, measure, and report on advertising. These cookies may track your browsing across sites to show you ads relevant to your interests.
Social media cookies — set when you click share buttons or embedded social posts.
Third-Party Cookies
Some cookies are set by third parties such as Google, Cloudflare, Stripe, Mailchimp, YouTube, Twitter/X, Facebook, Instagram, and our ad partners. These providers have their own privacy policies.
Your Choices
You can control cookies through your browser settings — most browsers let you block or delete cookies. Blocking strictly necessary cookies may break parts of the site.
For advertising cookies specifically, you can opt out of personalized advertising at:
We honor Global Privacy Control (GPC) signals where required.
Do Not Track
Our site does not respond differently to "Do Not Track" browser signals because there is no industry-wide standard for how to interpret them. We do, however, honor GPC signals as described above.
Changes
We will update this Cookie Policy as our practices change. The "Last updated" date at the top reflects the most recent revision.
Washington DC Magazine respects the intellectual property rights of others and expects users of our site to do the same. In accordance with the Digital Millennium Copyright Act ("DMCA"), 17 U.S.C. § 512, we will respond to valid notices of alleged copyright infringement.
Submitting a DMCA Takedown Notice
If you believe content on washingtondcmagazine.com infringes your copyright, please send a written notice that includes:
A physical or electronic signature of the copyright owner or a person authorized to act on the owner's behalf;
Identification of the copyrighted work claimed to have been infringed (or, for multiple works, a representative list);
Identification of the material claimed to be infringing, with sufficient detail to allow us to locate it (URL is best);
Your contact information — name, mailing address, telephone number, and email;
A statement that you have a good-faith belief that the use of the material is not authorized by the copyright owner, its agent, or the law;
A statement, under penalty of perjury, that the information in the notice is accurate and that you are the copyright owner or authorized to act on the owner's behalf.
Send Notices To
Designated Copyright Agent Washington DC Magazine LLC 1701 Pennsylvania Avenue NW, Suite 200 Washington, DC 20006 Email: dmca@washingtondcmagazine.com
Counter-Notice
If you believe content of yours was removed in error, you may submit a counter-notice with the same six elements above (substituting a statement under penalty of perjury that you have a good-faith belief the material was removed by mistake or misidentification) to the same address.
Repeat Infringers
We will terminate, in appropriate circumstances, the accounts of users who are repeat infringers.
False Claims
Under 17 U.S.C. § 512(f), any person who knowingly materially misrepresents that material is infringing — or was removed by mistake — may be liable for damages. Submit notices in good faith.
Reach Washington's most influential audience — the people who write policy, sign deals, attend openings, and shape culture in the nation's capital.
Our Audience
Washington DC Magazine reaches an engaged audience of policymakers, lobbyists, journalists, founders, executives, creatives, students, and lifelong DC residents. Our readers care about politics, culture, business, and the city itself.
What We Offer
Display advertising — High-visibility placements across the site, including homepage, category pages, and in-article units.
Newsletter sponsorships — The DC Insider (Tuesday + Friday) reaches engaged subscribers across DC, Maryland, and Virginia.
Sponsored content & branded series — Long-form storytelling produced in partnership with our editorial team, clearly labeled.
Event partnerships — Presenting and supporting sponsorships for our live programming.
Custom packages — Multi-channel campaigns combining display, newsletter, and content.
Why Advertise With WDCM
Hyper-local DC audience with national reach;
Brand-safe environment with strict content standards;
Premium ad units, no autoplay video, no pop-unders;
Transparent reporting on every campaign.
Request Our Media Kit
Email advertise@washingtondcmagazine.com for current rates, audience demographics, and the full media kit. We respond within one business day.
Washington DC Magazine is building a modern, independent publication for the nation's capital — and we're growing.
Who We Are Looking For
We hire reporters, editors, photographers, videographers, newsletter writers, ad operations specialists, engineers, and business operators who care about Washington and want to build something that lasts.
Current Openings
We post openings here when we have them. Roles we hire for from time to time include:
Freelance contributors (per-piece rates available on request);
Sales and partnerships;
Engineering and product.
Pitch Us
Even if no role is currently posted, we welcome pitches and introductions. Send a brief note about who you are, what you do, and how you'd contribute to careers@washingtondcmagazine.com. Include links to recent work.
Freelance Pitches
For freelance story pitches, please email editor@washingtondcmagazine.com with a one-paragraph pitch, a working headline, and links to two or three samples of your work.
Internships
We offer paid editorial internships on a rolling basis. Email careers@washingtondcmagazine.com with a résumé and writing samples.
Equal Opportunity
Washington DC Magazine is an equal-opportunity employer. We make hiring decisions without regard to race, color, religion, national origin, sex, sexual orientation, gender identity, age, disability, veteran status, or any other protected category.
Welcome to the Washington DC Magazine Press Room — a single place for journalists, researchers, partners, and event organizers to learn about our publication.
About Washington DC Magazine
Washington DC Magazine is an independent digital publication covering politics, culture, business, and lifestyle in the nation's capital. Founded by Rodriquez Wright II, the publication reaches a national audience of DC-connected readers — policymakers, lobbyists, founders, journalists, and lifelong residents.
Media Inquiries
For interview requests, panel invitations, podcast appearances, and quotes from our editor or contributors:
Need a logo, headshot, or boilerplate? Email press@washingtondcmagazine.com and we'll send our press kit, including high-resolution logos (light and dark), a one-paragraph boilerplate, and approved photographs.
Press Releases
Submit press releases via editor@washingtondcmagazine.com. We do not guarantee coverage of submitted releases but read everything.
In the News
Washington DC Magazine has been quoted, cited, or featured in coverage by other outlets. For a current list of mentions, contact our press team.
Speaking Requests
Our editor and contributors speak at universities, industry events, conferences, and corporate retreats. Email press@washingtondcmagazine.com with date, audience, and topic.
CAN I KICK IT? screens New Jack City at the Sylvan Theater, Washington Monument, on Aug. 22. (Courtesy SHAOLIN JAZZ)
The live-cinema series CAN I KICK IT? returns to the National Mall this month with what its producers are calling the "Gangsters on the Mall" chapter of their free outdoor summer run. On Saturday, August 22, the SHAOLIN JAZZ production brings the 1991 crime classic New Jack City to the Sylvan Theater at the Washington Monument for a night of film, music, and community under the DC summer sky.
What sets the event apart is the sound. As the film plays, DJ 2-Tone Jones builds an original score in real time, reimagining one of the most iconic crime movies of the ’90s through hip-hop, soul, funk, and more. It is less a movie screening than a live performance built around the film.
The details:
Film: New Jack City (1991), with a live soundtrack by DJ 2-Tone Jones
When: Saturday, August 22 — seating opens at 7:30 p.m. (bring lawn chairs and blankets); film begins at 8:30 p.m.
Where: Sylvan Theater at the Washington Monument, Independence Ave SW & 15th St NW
A parking note from the organizers: expect road closures and restricted parking east of 14th Street NW due to a separate race event in the District. Roads west of 14th Street NW will be accessible and available for parking.
New Jack City is the second of three screenings in this year’s free CAN I KICK IT? outdoor series, which opened with Black Panther at Skyland Town Center and concludes with Scarface at the Lincoln Memorial on September 5. Produced by the Washington, DC-based multimedia arts company SHAOLIN JAZZ, the series has presented more than 150 live cinematic experiences at venues across the country, from Lincoln Center to SXSW.
"I wanted to be able to tell good stories with substance and remove the ‘ego’ out of the art," said Andrew Huang during a recent interview. Now, he’s building his career at the intersection of discipline, creativity and innovation.
Andrew Huang, founder of New Place Studios. (Courtesy photo)
As a Chinese American, Huang was reared with a deep respect for hard work, consistency and excellence. He describes his childhood as "not so affluent" and later attended college to hone his passion for videography. "In college I tried to do something I loved, which was video, but along the way I knew that I had to find a job. And so I thought, ‘what was the low hanging fruit to get to that stable 9 to 5 job?,’" he stated.
Later in life, Huang found himself working for corporations where his creativity was often limited, eventually leading to burnout. "I worked in a corporation for a long time and there were a lot of missing pieces. I wanted to fill in gaps missing in corporate video production," said Huang.
He later described how his upbringing and a mindset of "survival" led him toward a corporate career. However, his desire for balance and authentic storytelling ultimately pushed him to take the entrepreneurial leap.
"I founded a new place where you can create video and film with ‘substance and style,’" said Huang. His desire for work-life balance and passion for storytelling naturally evolved into a small business based in Virginia. With the launch of New Place Studios, the entrepreneur quickly found himself reconnecting with the values that would become the foundation of everything he creates behind the camera.
Huang said being a business owner has allowed him to first embrace himself. While others may see video as simply capturing moments, he sees it as a way to preserve stories that inspire, connect and leave a lasting imprint.
By combining cinematic visuals with cutting-edge production techniques and a keen understanding of branding, Huang helps organizations and individuals communicate their vision with purpose. He said understanding a client’s "why" serves as the compass for delivering the services they need.
One benefit of working with a small business, he said, is that clients get to see the production process unfold through a micro lens while working with the same faces throughout the entire project. "The work feels personal," said Huang.
Huang does not regret leaving behind the flash-over-substance mentality and corporate hustle culture. That does not mean the Asian American entrepreneur has been without challenges in the industry. "It’s relatively hard to find other Asian American creatives or people who would want to work with me in the DMV," said Huang.
He identifies the industry culture in which everyone is trying to blend in, creatives may fear displaying their Asian identity and some feel pressure to adopt an American corporate persona. He also points to what he describes as a level of gatekeeping within the industry. According to the U.S. Small Business Administration’s 2024 statistics, Asian American and Pacific Islander entrepreneurs own more than 3 million businesses and employ 5.2 million people in the United States.
After tapping into organizations such as SCORE, which offers free small business mentorship, New Place Studios has become a trusted creative partner throughout the DMV (Washington, D.C., Maryland and Virginia). The company produces a range of creative services, including commercials, corporate branding, documentaries, film, 2D animation, motion graphics and photography.
For Huang, entrepreneurship has become more than a departure from corporate life. It has given him the freedom to create with intention, build meaningful connections and tell stories that go beyond the surface.
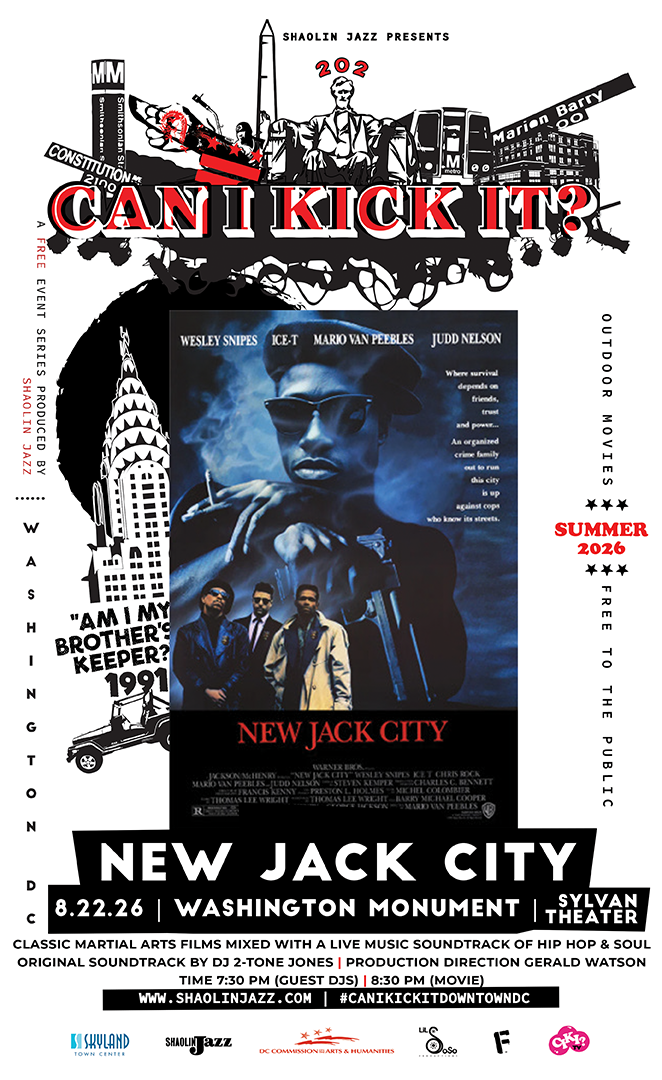
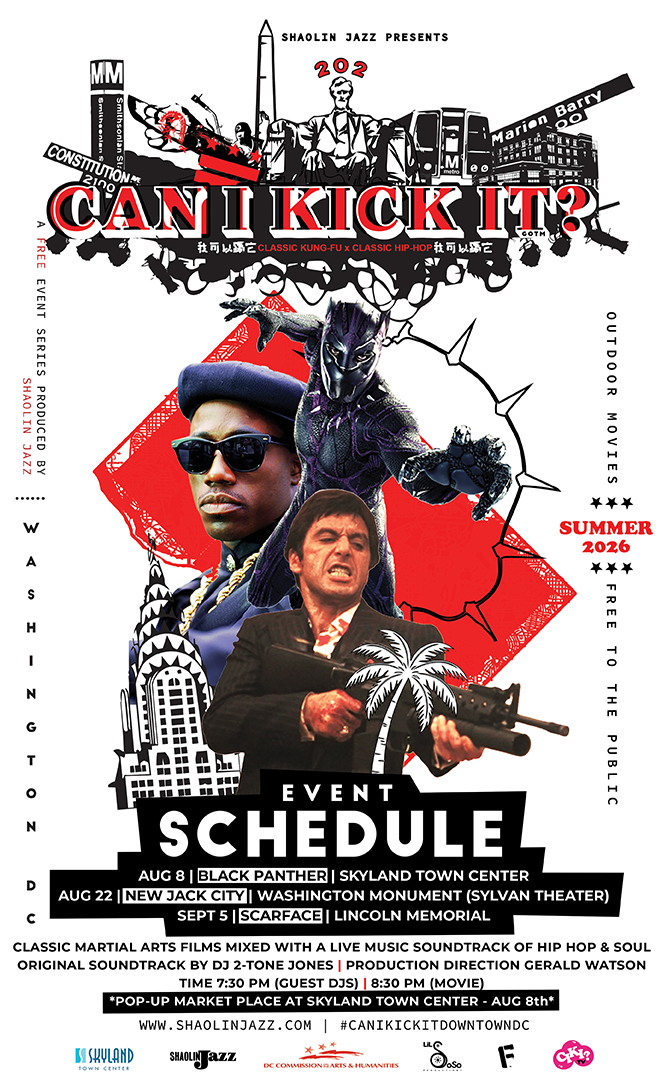
The 2026 CAN I KICK IT? outdoor series. Poster courtesy of SHAOLIN JAZZ.
For three Saturdays this summer, some of Washington’s most familiar public spaces will do something they rarely do after dark: fill up with blankets, lawn chairs, and the sound of a movie being scored live, in real time. CAN I KICK IT?, the traveling “live cinema” series produced by the DC-based multimedia arts company SHAOLIN JAZZ, is bringing a free outdoor run to the city — pairing three era-defining films with an original soundtrack performed on the spot by DJ 2-Tone Jones.
The premise is what sets it apart from a normal screening in the park. Rather than simply pressing play, 2-Tone Jones builds a score as the film unfolds, pulling from hip-hop, soul, funk, jazz, rock, electronic music, and sounds from around the world. The result, the organizers say, is less a movie night than a one-time performance — the same film you know, wired to a soundtrack you have never heard and will not hear again. Guest DJs warm up the crowd starting at 7:30 PM before each 8:30 PM screening.
The 2026 outdoor schedule
All three events are free and open to the public.
Saturday, August 8 — Black Panther at Skyland Town Center. A pop-up marketplace and community activities kick off the evening; guest DJs at 7:30 PM, film at 8:30 PM. Marvel’s superhero epic gets a one-night-only live score in Southeast DC.
Saturday, August 22 — New Jack City at the Sylvan Theater, Washington Monument. Seating begins at 7:30 PM; the film starts at 8:30 PM. The 1991 crime drama plays out at the foot of one of the country’s most recognizable landmarks.
Saturday, September 5 — Scarface at the Lincoln Memorial. Seating at 7:30 PM; film at 8:30 PM. The series closes with Brian De Palma’s crime saga against the backdrop of the Memorial, scored live from start to finish.
First up: Black Panther at Skyland Town Center on August 8. Poster courtesy of SHAOLIN JAZZ.
A DC company with a national footprint
SHAOLIN JAZZ describes itself as a Washington-based arts company working at the intersection of music, film, art, and culture, and CAN I KICK IT? is its signature production. According to the organizers, the series has staged more than 150 live cinematic experiences around the country — at performing arts centers, museums, festivals, and cultural institutions including Lincoln Center in New York, SXSW, the Denver Center for the Performing Arts, Republic Square in Austin, the Tacoma Armory, and The Cary Theater.
“CAN I KICK IT? has always been about creating a shared experience,” said Gerald Watson, co-founder of SHAOLIN JAZZ. “When you combine iconic films with live music in public spaces, something special happens. People aren’t just watching a movie — they’re experiencing it together. That’s what makes these nights so memorable.”
Cinema as a community event
The DC run lands as cities across the country look for new ways to activate public space through arts and culture — and this series is a straightforward pitch for how to do it: take a landmark everyone already knows, add a film everyone has an opinion about, and let a live soundtrack turn the evening into something neighbors experience shoulder to shoulder. Families, film buffs, and music fans are all invited, and admission won’t cost a thing.
The CAN I KICK IT? outdoor series runs August 8, August 22, and September 5. All events are free; check SHAOLIN JAZZ (shaolinjazz.com) for the latest details and any weather updates before heading out.